NMR spectrum table in easy way to remember
by egpat 21-11-2017
To assign a particular peak to specific proton in a molecule, NMR spectrum table acts as a great tool. It gives an idea on approximate chemical shift values of various protons in NMR spectra. We can use this table to match with measured values and can predict which type of proton it is.
To get more clarity, let’s start with a simple example such as propane.
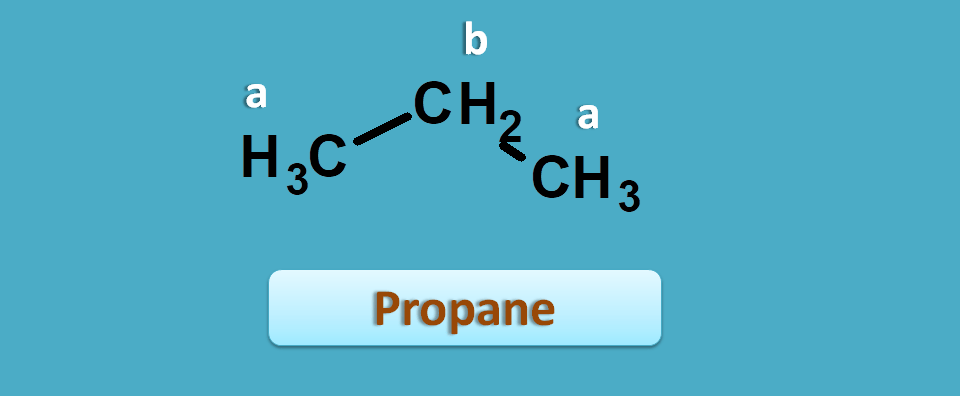
It has two non-equivalent protons indicated by “a” and “b” corresponding to methyl and methylene protons respectively.
Suppose proton NMR spectra of this compound has given two peaks with chemical shifts being 0.893 and 1.308 ppm respectively.
Which peak is of 0.893 ppm?
Let’s check in the NMR spectrum table.
The approximate values of methyl and methylene protons are 0.9 and 1.3 ppm respectively.
Now you can compare with observed values. So, 0.893 corresponds to methyl and 1.308 corresponds to methylene.
So simple, isn’t it?
Let’s take another example.
This time let’s take 1-bromopropane. It shows three NMR peaks.
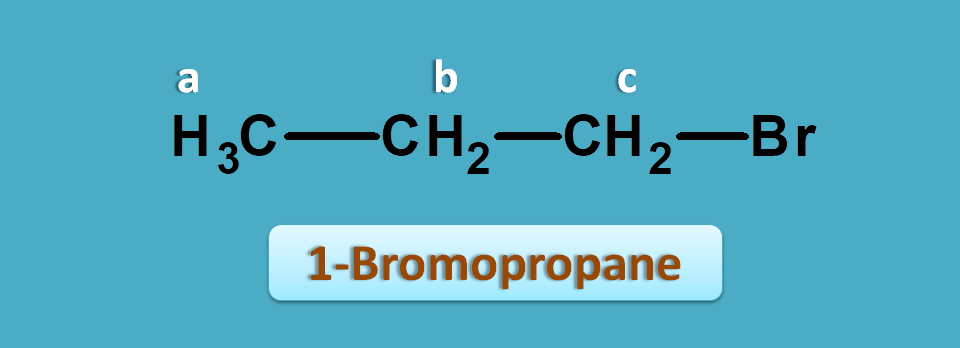
One is of methyl proton and other two are of methylene protons. But the methylene protons are not equal. Methylene proton indicated by “c” is attached carbon bearing bromide.
Suppose, the observed values of this compound are 1.0, 1.9 and 2.4 ppm.
Now again if we check for approximate values in the NMR table we can observe that protons α to halogens fall in the region of 1.5 to 2.5 ppm.
So, the peak with 2.4 ppm corresponds to -CH2Br. Similarly peaks with 1.0 and 1.9 ppm corresponds to methyl and methylene (-CH2-) protons.
Again it looks quite easy.
So by using NMR spectrum table, we can compare odd and evens and finally assign the peak to a particular proton easily. Of course, molecular formula and degree of unsaturation also add some information for easy retrieval.
But how to remember this table easily?
Let’s have some trick.
Before going into that let’s see the influence of the following on chemical shifts.
- pi electrons
- n electrons
Pi electrons
Pi electrons cause delocalization of electrons and the resulting magnetic field produces a decreased electron density surrounding proton.
Hence wherever they are present, they increase deshielding thereby increase chemical shift.
For example, vinylic protons have more chemical shift than saturated alkyl protons.
n electrons
Similarly n electrons are mainly present on electron negative atoms such as halogens, oxygen and nitrogen which again pull the electron away from the proton decreasing the electron density. So again this causes deshielding effect increasing chemical shift.
Just we have seen above that protons in –CH2Cl have more chemical shift than protons in –CH2-.
NMR spectrum table in easy way
Let’s have few steps in this process.
- First identify the environment protons and check for the presence of pi or n electrons.
- Next check how they attached either directly or by α-position
Now let’s divide the protons into following categories based on how they attached with pi or n electrons.
Type of electrons | chemical shift range |
|---|---|
| No pi electrons | 0.0-1.5 |
| α pi electrons | 1.5-2.5 |
| α n electrons | 2.5-4.5 |
| pi electrons | 4.5-6.5 |
| Aromatic pi electrons | 6.5-8.0 |
| Pi and n electrons | 9.0-12.0 |
No pi electrons
These are the protons attached to carbon not bearing any pi electrons, in another word these are saturated alkyl protons.
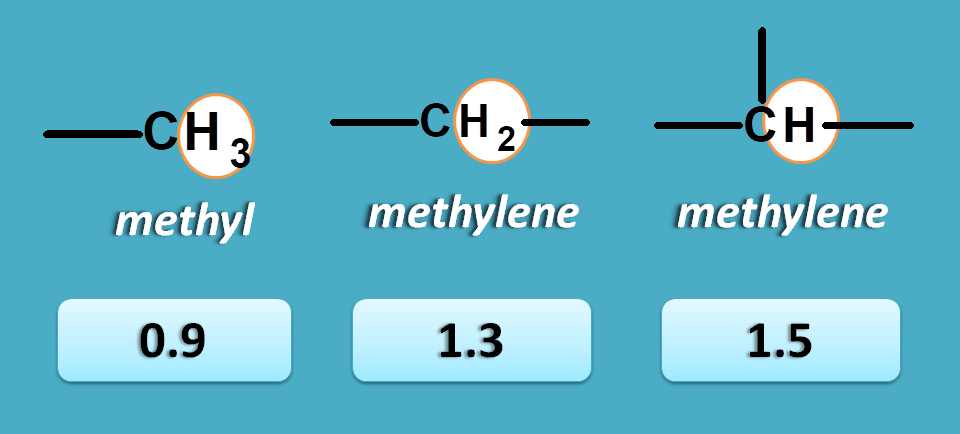
Here we have three types of protons including methyl, methylene and methine protons with chemical shifts such as 0.9, 1.3 and 1.5 ppm respectively.
α-pi electrons
Here the protons are attached to the carbon which has pi electrons at α position. The pi electrons may be present with carbon as in alkenes or with oxygen as in the carbonyl compounds.
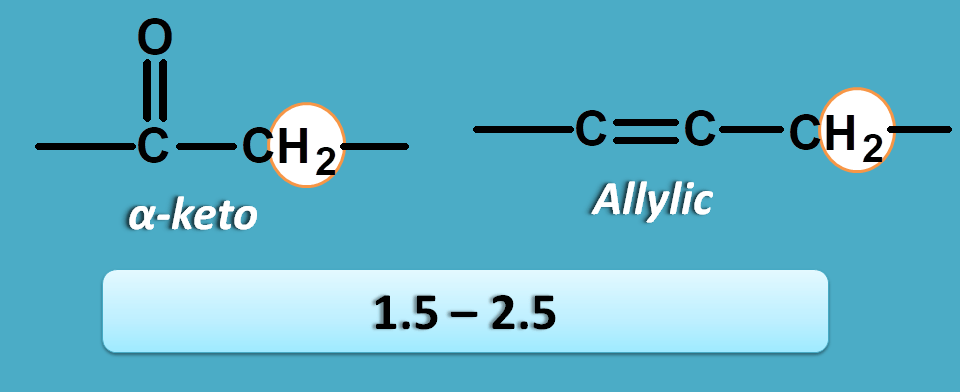
Now these protons fall within the region of 1.5 to 2.5 ppm.
α- n electrons
This group includes a heteroatom attached at alpha position to the carbon bearing proton. So we can found such type of protons in alcohols, amines and alkyl halides.
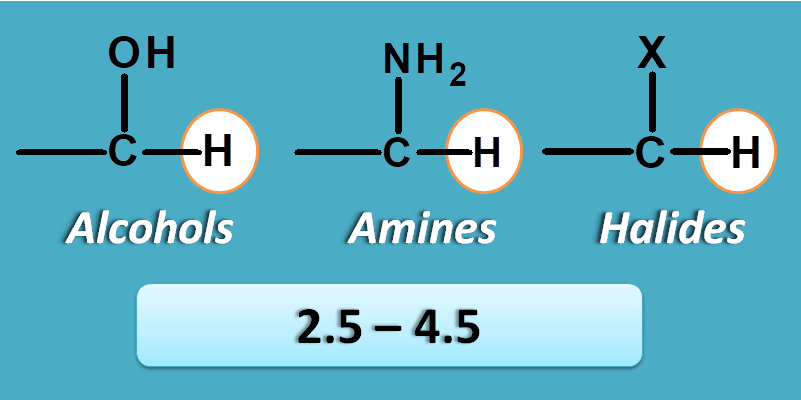
These protons fall in the region of2.5 to 4.5 ppm.
pi electrons
This is the case with protons attached to a carbon bearing pi electrons. In another words, this group belongs to protons in alkenes at double bond.
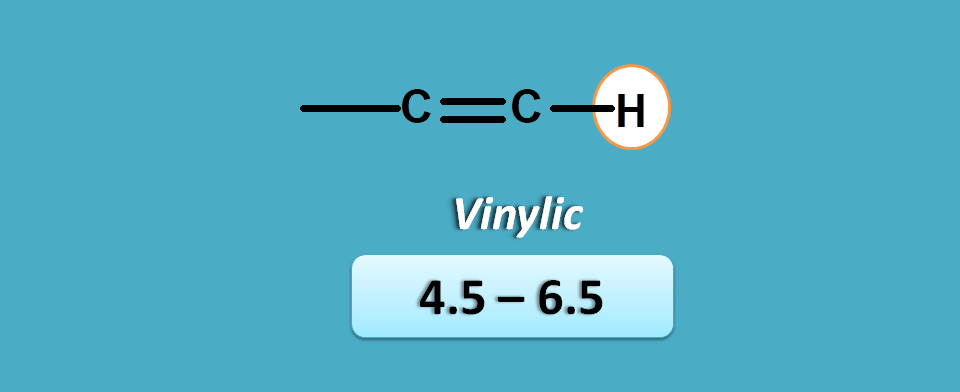
As they are directly attached to pi electrons, they have more deshielding hence more chemical shift. They fall in the region of 4.5 to 6.5 ppm.
Aromatic pi electrons
Aromatic pi electrons at the proton produce more deshielding due to delocalization of pi electrons which bring a deshielding region surrounding protons.
Due to resonance stabilization, the protons are more deshielded in aromatic compounds compared with the protons of alkenes.

Hence these protons fall in the region of 6.5 to 8 ppm.
Pi and n electrons
This is last group in the NMR spectrum table that contains protons with high deshielding effect hence fall at left part of the NMR spectra.
Here the proton is attached to a carbon which has pi electrons and heteroatom with n-electrons. One such group is aldehyde.
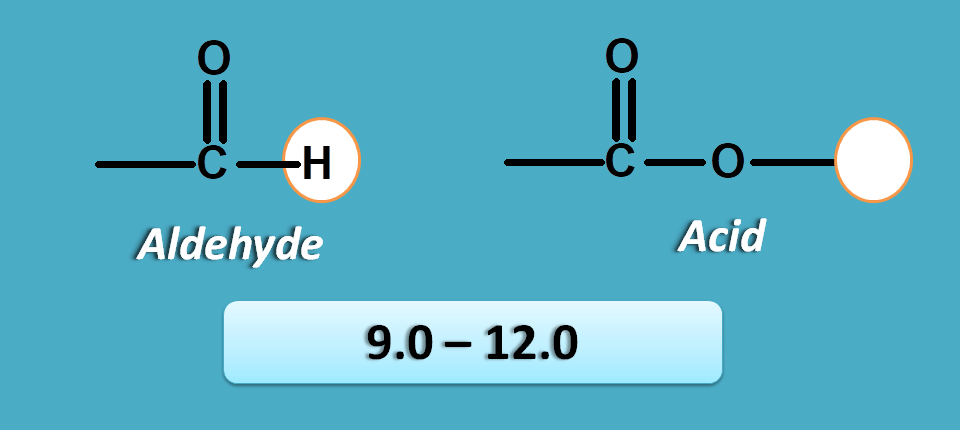
Similarly protons in carboxylic acid group are attached to oxygen which is attached to carbon bearing pi electrons.
So at these protons both n and pi electrons produce deshielding effect resulting in high chemical shift.
Let’s see how simple it is now to assess the proton by using NMR spectrum table.
Practical examples
Let’s take the same example we have discussed above i.e. 1-bromopropane. It gives three signals indicated by a,b and c .
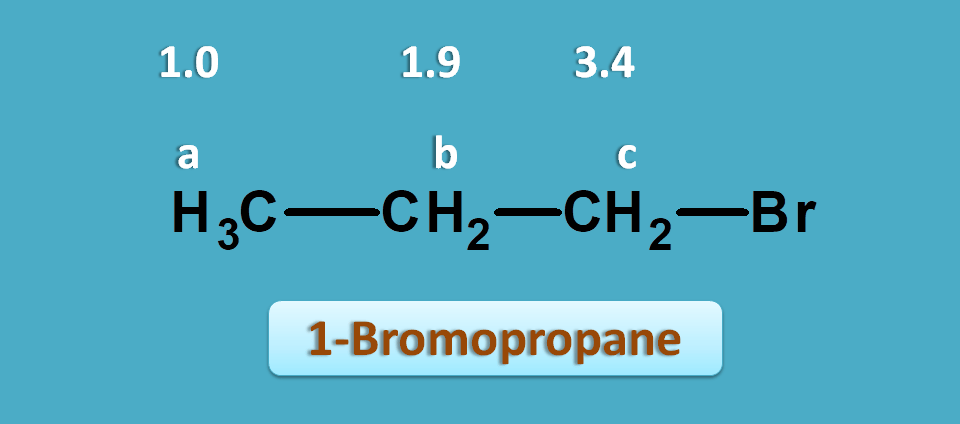
The proton a and b are neither attached to pi electrons nor to n electrons. Therefore they fall in the first region i.e 0 to 1.5 ppm. Similarly proton indicated by c has n-electrons at α position. So they fall in the region of 2.5 to 4.5 ppm.
Practically, 1-bromorpopane gives three signals approximately around 1,1.9 and 3.4 ppm.
The peak at 1ppm is due to methyl protons and peak at 3.4 is due to methylene protons attached to bromine.
Other methylene protons normally fall at 1.3 ppm but due to presence of bromine on adjacent carbon they fall at 1.9 ppm.
Now let’s take another example such as 2-pentanone.
The approximate NMR spectral values for this compound are 0.9,1.6, 2.1 and 2.4 ppm.
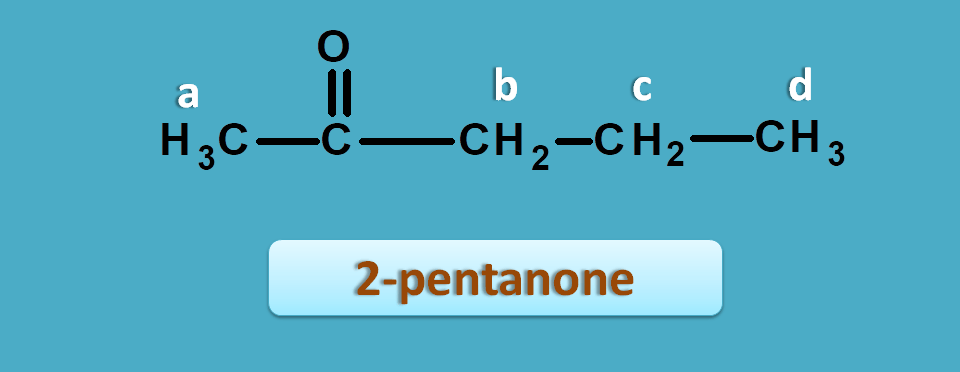
We can easily interpret that protons of 0.9 and 1.6 ppm are due to isolated protons and peaks of 2.1 and 2.4 ppm are due α-carbonyl protons.
a and b are α-to keto hence fall within can clearly observe that it has two types of methyl protons one being α-to carbonyl group and another is isolated.
So now isolated methyl proton fall in the region of 0 to 1.5 ppm and α-keto protons fall in the region of 1.5 to 2.5 ppm.
So the peak corresponding to 1.0 ppm is due to methyl protons
That’s about the easy way of interlinking the concept to remember NMR spectrum table with both logic and reasoning.